Web Diagram
In my American Government class, we began the discussion of the legislative branch. One of the important aspects of this branch is the process of how a bill becomes a law. This semester I decided that we would do it with a tech tool, which could allow for collaboration, correction, etc.
 Initially, I had students use "Mindmaps by mindmapmaker.org" to diagram how a bill becomes a law. After the first day of students working with this tool, it became apparent that it was a frustrating tool for the students. (Mindmaps may be a wonderful tool, but for what I was asking my students to do, it was not helpful.)
Doesn't Work... Fix it
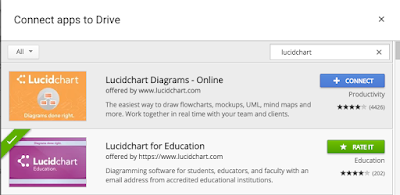
As I saw the frustration on my students' facez, I decided it was time to find a new tool. So I went back to drive and looked for another web diagraming tool. That's when I found "Lucidcharts for Education," and immediately I knew it was going to be a better tool for our project. It allowed students to make any adjustments seamlessly, while also saving instantly (which mindmap failed to do).
Lucidcharts
 Initially when you sign up for Lucidcharts, it places you in the "free-version" which has various restrictions such as: create only 5 documents and the use of 60 "complexities" (or as I told my students "symbols"). For the project we were doing, the "complexities" limitation was frustrating, but as a program, the students absolutely loved it! It allowed for quick adjustments, additions, and reformatting that was excruciatingly tough to do on Mindmaps.
How to use Lucidcharts
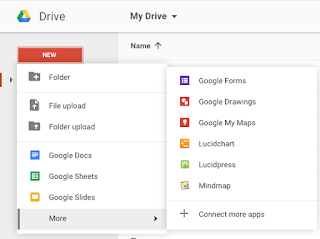
To create a web diagram using Lucidcharts, just go to your Drive and click the following: New-->More-->Lucidcharts. Then create a document (either blank or from one of their templates) in order to get started. From there, you can drag various symbols over from the left toolbar such as Text, Shapes, etc. With the boxes or text on the document, you can draw lines to help create a flow from one step to the next. (After Lucidchart approved our school for the free education upgrade, you will have unlimited complexities! That definitely made all the difference). To help make the web diagram stand out, students can change the fill color of the boxes, lines, text, etc.

For our project, I suggested to students that they color code the steps to help them quickly identify things like vocabulary or the house/senate differences. Finally, students can share their projects with each other as a point of reference. It was interesting how different students found steps/information that other students had missed, so sharing it with each other helped them to add them to their own project. Also, (unlike Mindmaps) Lucidcharts allows individuals to work simultaneously with one another (just like the other Google Apps Tools).
Google Classroom - Turn It In

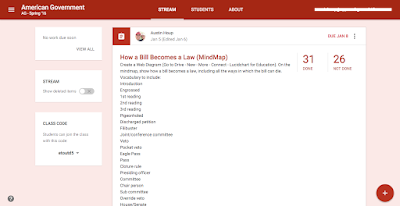
I provided the assignment through Google Classroom with the expectations. As students found valuable resources, they would share them via the "class comment" so that other students could use them. When students finished, they would add it to Google Classroom the same way they would turn in other Google Apps products (docs, sheets, slides, etc.).